On this page
Too long? Read this
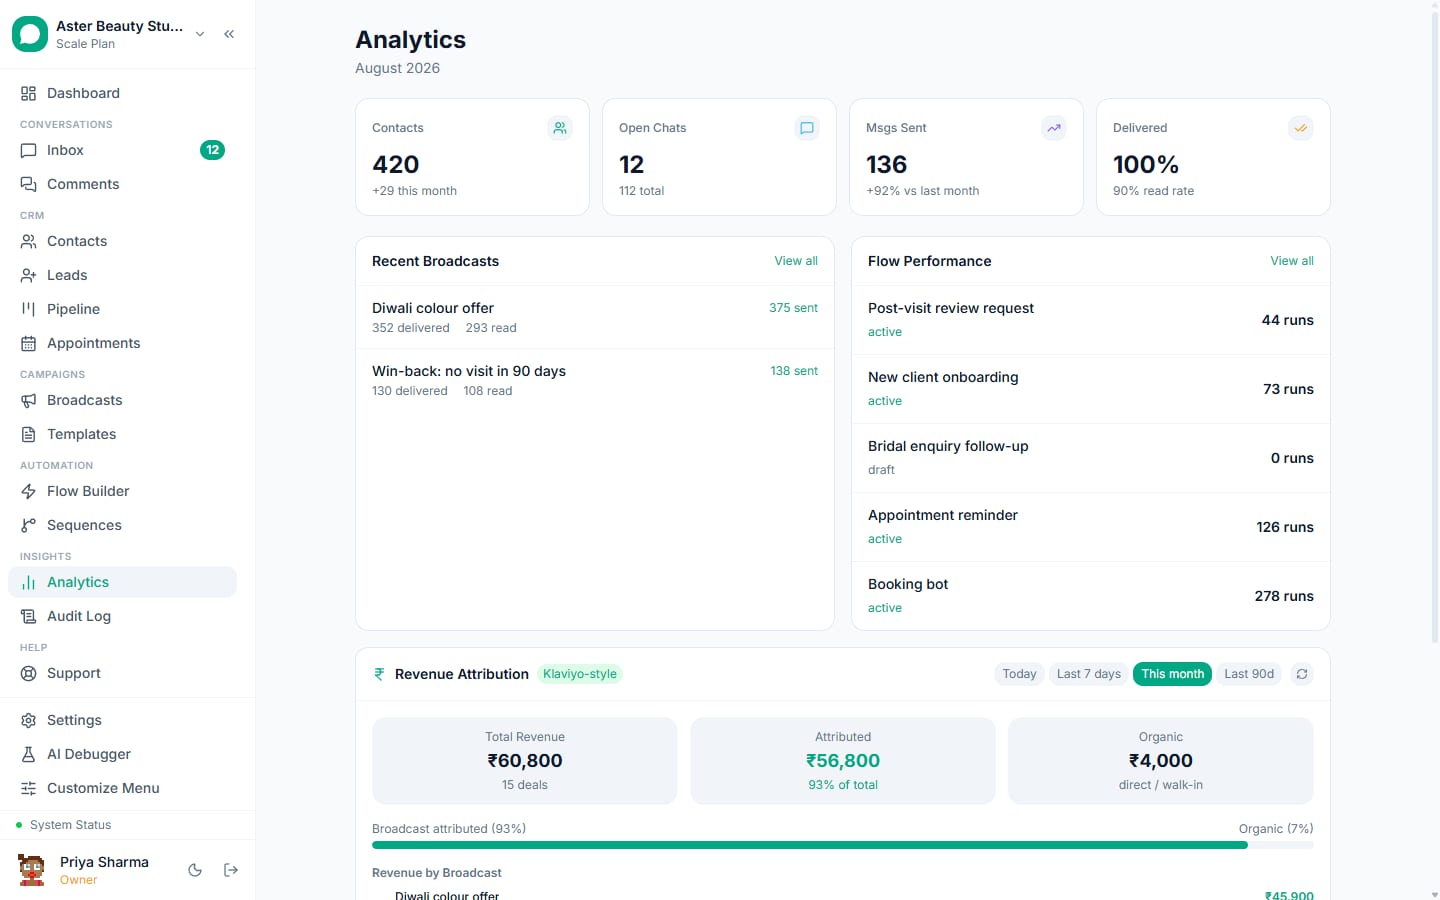
- ROI needs three inputs most teams do not collect: cost per campaign (Meta charges plus platform share), revenue attributed to conversations, and the funnel per campaign (sent, delivered, read, replied, clicked)
- Two numbers settle budget decisions: cost per reply and revenue per 1,000 sends; read rate is a floor, not a result
- Attribution works when purchases are logged on the conversation, payment links do it automatically, and ad-driven chats carry the ad id
- A worked month for a coaching institute, a dashboard layout, and the mistakes that inflate or hide ROI
WhatsApp marketing ROI is revenue attributed to campaigns minus what they cost, divided by what they cost. Simple to define, rarely measured, because three inputs are usually missing: the exact cost of each campaign (Meta's charges plus a share of the platform fee), the revenue that each conversation produced, and a per-campaign funnel that separates delivered from read from replied. This guide sets up all three, names the two numbers that actually settle budget decisions (cost per reply and revenue per 1,000 sends), walks through a month for a coaching institute, and lists the mistakes that make ROI look better or worse than it is.
The inputs
1. Cost per campaign
Meta bills per delivered template message at the recipient country's rate: India, April 2026, Rs 0.8631 marketing, Rs 0.115 utility, free replies inside a customer's 24-hour window. Suppressed and failed rows are not billed. The platform fee is monthly; apportion it across campaigns by sends, or hold it as a fixed cost against total WhatsApp revenue. VGraple CRM shows the estimated Meta cost on the review screen and the actual on the campaign page.
2. Revenue per conversation
Revenue has to land on the conversation to be attributable. Three ways: payment links sent in chat attribute automatically when paid; agents log revenue on a conversation when a sale closes elsewhere; an order system posts the order to the contact through the API or Zapier. Each logged amount carries the contact, the conversation, the agent, and the campaign, sequence step or ad that touched the contact within the window.
3. The funnel per campaign
Sent, delivered, read, replied, clicked, failed and suppressed, per recipient, per campaign, with the Meta reason on failures. Without per-recipient data the funnel is a guess.
The two numbers that settle decisions
Cost per reply = campaign cost / replies (or button clicks). It tells you whether the segment and the message worked, and it is comparable across campaigns, channels and months. Rs 5 to Rs 30 is typical for opted-in Indian consumer lists.
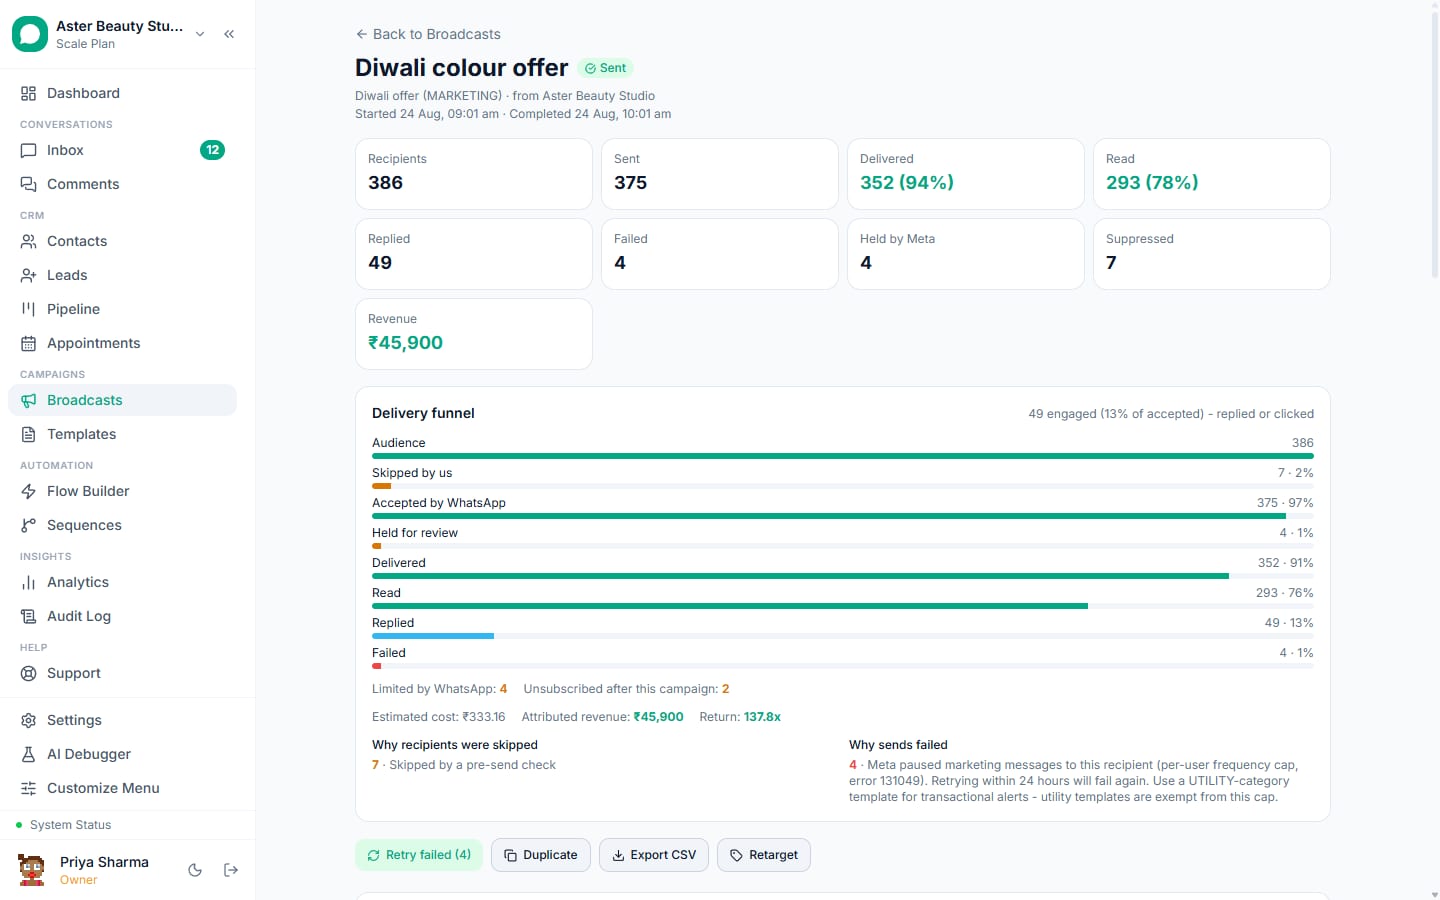
Revenue per 1,000 sends = attributed revenue / (sends / 1,000). It tells you what a campaign is worth and whether to send it again. It is also the number that stops arguments about read rates.
Everything else diagnoses: delivered rate (list health, caps, tiers), read rate (timing, first line), block rate (consent, frequency).
Attribution: choose a rule and keep it
| Rule | Use when | Window |
|---|---|---|
| Last touch | Promotions with a clear ask | 7 days |
| First touch | Ad-driven conversations (click-to-WhatsApp, lead ads) | 30 days |
| Sequence step | Nurture and recovery sequences | Until the sequence ends |
| Conversation | Any revenue logged on a chat the campaign started | Life of the conversation |
Pick one per campaign type, document it, and do not change it between months. Ad-driven chats carry the ad, ad set and campaign ids from Meta; purchase events sent back through the Conversions API give Ads Manager the same view.
A worked month: coaching institute
Apex Academy, 4,000 opted-in enquirers, Growth plan (Rs 3,499).
| Campaign | Sends | Delivered | Read | Replied | Meta cost | Revenue | Cost per reply | Revenue per 1,000 |
|---|---|---|---|---|---|---|---|---|
| Batch launch (marketing) | 4,000 | 3,720 | 2,680 | 310 | Rs 3,211 | Rs 2,40,000 (16 enrolments) | Rs 10.4 | Rs 60,000 |
| Fee deadline (utility, enrolled) | 420 | 415 | 380 | 60 | Rs 48 | Rs 1,80,000 (12 instalments on time) | Rs 0.8 | Rs 4,28,571 |
| Counsellor follow-up sequence (3 steps) | 930 | 890 | 640 | 140 | Rs 505 | Rs 1,05,000 (7 enrolments) | Rs 3.6 | Rs 1,12,903 |
| Result-story retarget (marketing, readers only) | 2,000 | 1,940 | 1,500 | 90 | Rs 1,674 | Rs 45,000 (3 enrolments) | Rs 18.6 | Rs 22,500 |
Meta charges Rs 5,438; platform Rs 3,499; total cost Rs 8,937; attributed revenue Rs 5,70,000; ROI about 63 times. The fee deadline campaign, a utility message, produced the highest revenue per 1,000 sends at a fraction of the cost; the retarget campaign was the weakest and would be cut or reworded next month. That is what the two numbers are for.
Build the dashboard
One table per month, one row per campaign or sequence, the columns above, plus blocks and 131049 failures for diagnosis. Group by type (marketing, utility, sequence, ad-driven). Add three totals: WhatsApp revenue, WhatsApp cost, and revenue from conversations that customers started (inbound), which is the number that grows as the channel matures. VGraple CRM's analytics has campaign, agent and revenue views; export to a sheet for the month-over-month comparison.
Inbound revenue: the number that grows
Campaign ROI is the visible half. The other half is revenue from conversations customers start themselves after seeing a QR code, a click-to-chat link, an ad or the username on packaging: no template cost, a free 24-hour window, and usually higher intent than any broadcast. Tag the source on every inbound conversation (QR, website, ad, referral) and report inbound revenue by source next to campaign revenue. Over a year the inbound line typically overtakes campaigns for service businesses, and it is the strongest argument for putting the WhatsApp entry points everywhere.
A holdout, when the decision is big
For a campaign that will decide a budget, skip a random 10 percent of the segment and compare revenue between the sent and skipped groups over the attribution window. The difference is the campaign's real lift; last-touch attribution alone overstates it for customers who were going to buy anyway. VGraple CRM's A/B testing can hold back a slice of the audience for this purpose.
Monthly review, in four questions
- Which campaigns had the lowest cost per reply, and what did they have in common (segment, first line, hour)?
- Which had the highest revenue per 1,000 sends, and can they run again to the same cohort next month?
- Where did delivery fall (131049 share, tier, quality), and which segment caused it?
- What did inbound conversations earn by source, and which entry point deserves more visibility?
Mistakes that distort ROI
- Counting reads as results. Read is a floor and undercounts; it never enters the ROI formula.
- Attributing all revenue to WhatsApp. A customer who was going to buy anyway and received a reminder is partly WhatsApp's; use a consistent window and, for big decisions, a holdout group the campaign skips.
- Ignoring the platform fee (ROI too high) or charging it entirely to one campaign (too low).
- Forgetting inbound revenue. Conversations customers start after seeing a QR code or an ad are WhatsApp revenue with near-zero message cost; tag the source.
- Changing attribution rules between months. Trends vanish.
- No revenue logging discipline. If agents do not log sales, payment links are the only attributable revenue and the number is wrong.
What VGraple CRM does here
Per-recipient funnels and Meta cost per campaign, revenue attribution to conversations, campaigns, sequence steps, agents and ads, automatic attribution for payment links, Meta Conversions API events for ad-driven revenue, and analytics views by campaign and agent are on the Starter plan and above (revenue logging itself is on every plan). Exports feed the monthly sheet.