On this page
- First, split delivered from read
- Cause 1: recipients at Meta's per-user cap
- Cause 2: tier, quality or suppression
- Cause 3: a cold list
- Cause 4: the first line
- Cause 5: send time
- Cause 6: frequency
- Cause 7: read receipts (a measurement issue)
- A diagnostic in five minutes
- A worked diagnosis
- What to report to the owner
- Settings that stop the decline
Too long? Read this
- A "drop in open rate" is usually two different things: fewer messages delivered (caps, tiers, suppression) and fewer delivered messages read (list, timing, first line, frequency)
- Read receipts undercount: users who turn them off never show as read, so judge trends, not absolutes, and judge replies and clicks over reads
- Since 2025 Meta's per-user marketing cap holds messages to saturated recipients; the fix is engagement-based segments and utility templates, not resending
- Six causes, one diagnostic table, and the settings that stop the decline
A falling WhatsApp open rate is two problems wearing one label. The first is delivery: fewer of the messages you send reach a phone, because Meta's per-user marketing cap holds them, your daily tier runs out, or the platform suppresses recipients who should not be messaged. The second is reading: fewer delivered messages get opened, because the list has gone cold, the first line does not earn the tap, the send time is wrong, or you are sending too often. Dashboards that report "open rate" as reads divided by sends blur the two. Separate them and each of the six causes below has a specific fix; read receipts, which undercount, add a seventh thing to keep in mind.
First, split delivered from read
| Ratio | What it measures | Healthy (opted-in Indian list) |
|---|---|---|
| Delivered / sent | Whether messages reach phones | 92 to 97 percent |
| Read / delivered | Whether delivered messages are opened | 60 to 80 percent within 24 hours |
| Replied or clicked / delivered | Whether the message did anything | 3 to 10 percent (marketing), higher for utility |
If delivered / sent fell, go to causes 1 and 2. If read / delivered fell, go to causes 3 to 6. If both held and only the dashboard number moved, check cause 7.
Cause 1: recipients at Meta's per-user cap
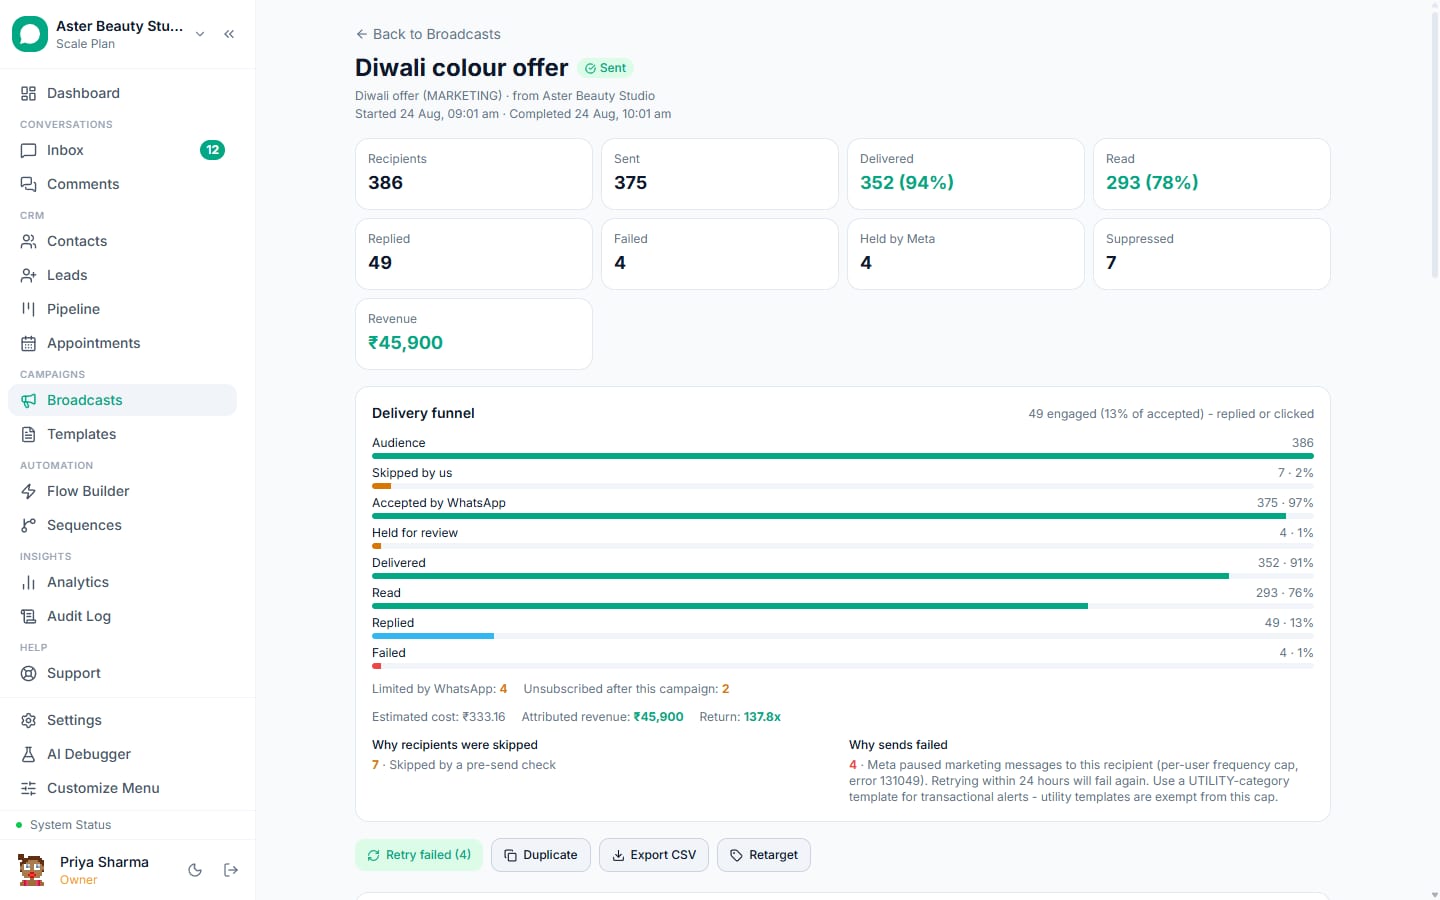
Symptom: a growing share of marketing sends fail with 131049, especially to contacts who have not engaged recently. Fix: send marketing to engagement-based segments (readers and repliers of the last 30 to 60 days), move transactional content to utility templates, and never retry capped recipients (Meta penalises accounts that do). Expect cold segments to cap at 20 to 40 percent; that is the segment, not the message.
Cause 2: tier, quality or suppression
Symptom: a campaign stops partway (tier exhausted), sends slow (quality rating fell), or the recipient count on the review screen is lower than the segment size (suppression removed opted-out, blocked, unreachable and capped contacts). Fix: let the campaign resume when the tier window reopens; recover the quality rating by pausing marketing for a few days; and treat suppression as correct, not as a loss. Why broadcasts get blocked covers recovery.
Cause 3: a cold list
Symptom: delivered holds, read falls campaign over campaign, blocks creep up. The list has people who opted in months ago and have not heard from you since, or who opted in for order updates and now get offers. Fix: segment by recency of engagement; send a utility-style value message before the next promotion; suppress contacts with no engagement in 180 days from marketing; refresh consent with a "reply YES to keep getting offers" step in a welcome flow.
Cause 4: the first line
Symptom: delivered holds, read falls on specific campaigns, the ones whose templates open with a greeting and the business name. WhatsApp shows roughly 60 characters in the notification; that is the whole pitch. Fix: put the value in the first line ("Your Saturday slot is confirmed", "20% off keratin till Sunday", "Your report is ready"), then the name, then the ask. A/B test two first lines on a sample and let the winner go to the rest.
Cause 5: send time
Symptom: campaigns sent late evening or early morning read 20 to 30 points lower and draw more blocks. Fix: weekdays 10 am to 1 pm and 6 pm to 8 pm for consumer lists in India; mid-morning for B2B; nothing after 9 pm. Turn on quiet hours so a scheduled campaign never fires at night, and send-time optimisation so each contact gets the message at the hour they historically respond.
Cause 6: frequency
Symptom: reads fall steadily across a month while the list stays the same; blocks and cap hits rise together. Fix: one marketing broadcast a week per contact at most; utility messages on events only; a platform-level frequency cap so a contact who already received the set number of marketing messages in the window is left out of the next one.
Cause 7: read receipts (a measurement issue)
Users who turn off read receipts, or who read the notification without opening the chat, never register as read. The share of such users varies by audience; B2B lists run higher. This does not change what you should do, but it changes what you should trust: track reads as a trend across campaigns, and make decisions on replies, button clicks and revenue, which are not affected. Tracking delivery and read receipts explains each status.
A diagnostic in five minutes
- Open the last four campaigns; write down sent, delivered, read, replied, blocks for each.
- If delivered / sent dropped: count 131049 failures (cause 1), check the tier and quality rating (cause 2), compare recipient count to segment size (suppression, correct).
- If read / delivered dropped: compare send times (cause 5), first lines (cause 4), frequency per contact that month (cause 6), and the segment's last-engagement dates (cause 3).
- If neither ratio moved but the headline number did, the dashboard is dividing by sends instead of delivered, or read receipts shifted (cause 7).
- Change one thing per campaign so you can see which fix worked.
A worked diagnosis
A salon's monthly offer read 74 percent in June, 61 in July and 48 in August. Delivered / sent stayed at 95 percent all three months, so caps and tiers were not the story. The send time moved from 11 am to 8:30 pm in July when the owner started scheduling after closing; the August template opened with "Namaste from Aster Beauty Studio" instead of the offer; and the same 3,000 contacts had received four marketing sends in August against two in June. Three causes, three fixes: quiet hours set to 9 am to 8 pm, the offer moved into the first line, and a frequency cap of one marketing broadcast per week. September read 71 percent on the same list. Nothing about the list itself needed changing yet; the 180-day engagement filter was added as a precaution for the following quarter.
What to report to the owner
Two ratios and two results, per campaign, on one line: delivered / sent, read / delivered, replies, revenue. When a number moves, the cause is almost always visible in the same row (the 131049 count, the send hour, the first line, the frequency per contact). Reporting a single "open rate" hides which of the six causes to fix and invites the wrong fix, usually a resend, which makes cause 6 worse.
Settings that stop the decline
- Engagement-based segments and retarget cohorts instead of full-list sends
- Utility templates for everything transactional
- Quiet hours and a marketing frequency cap
- Send-time optimisation and A/B testing on the first line
- Suppression of opted-out, blocked, unreachable and capped contacts, never retried
All of these are in delivery protection and the broadcast composer on every plan of VGraple CRM, including Free.