On this page
- What you get
- How it works
- Why does delivery rate use "delivered or read," not just "delivered"?
- What does the Sender Quality card actually protect you from?
- How does Agent Performance measure response and resolution time?
- What does CSAT collection look like, and when does it fire?
- Who uses it
- How does the dashboard respect who is allowed to see what?
- What Meta allows
- Plans and limits
- Recent improvements
In short
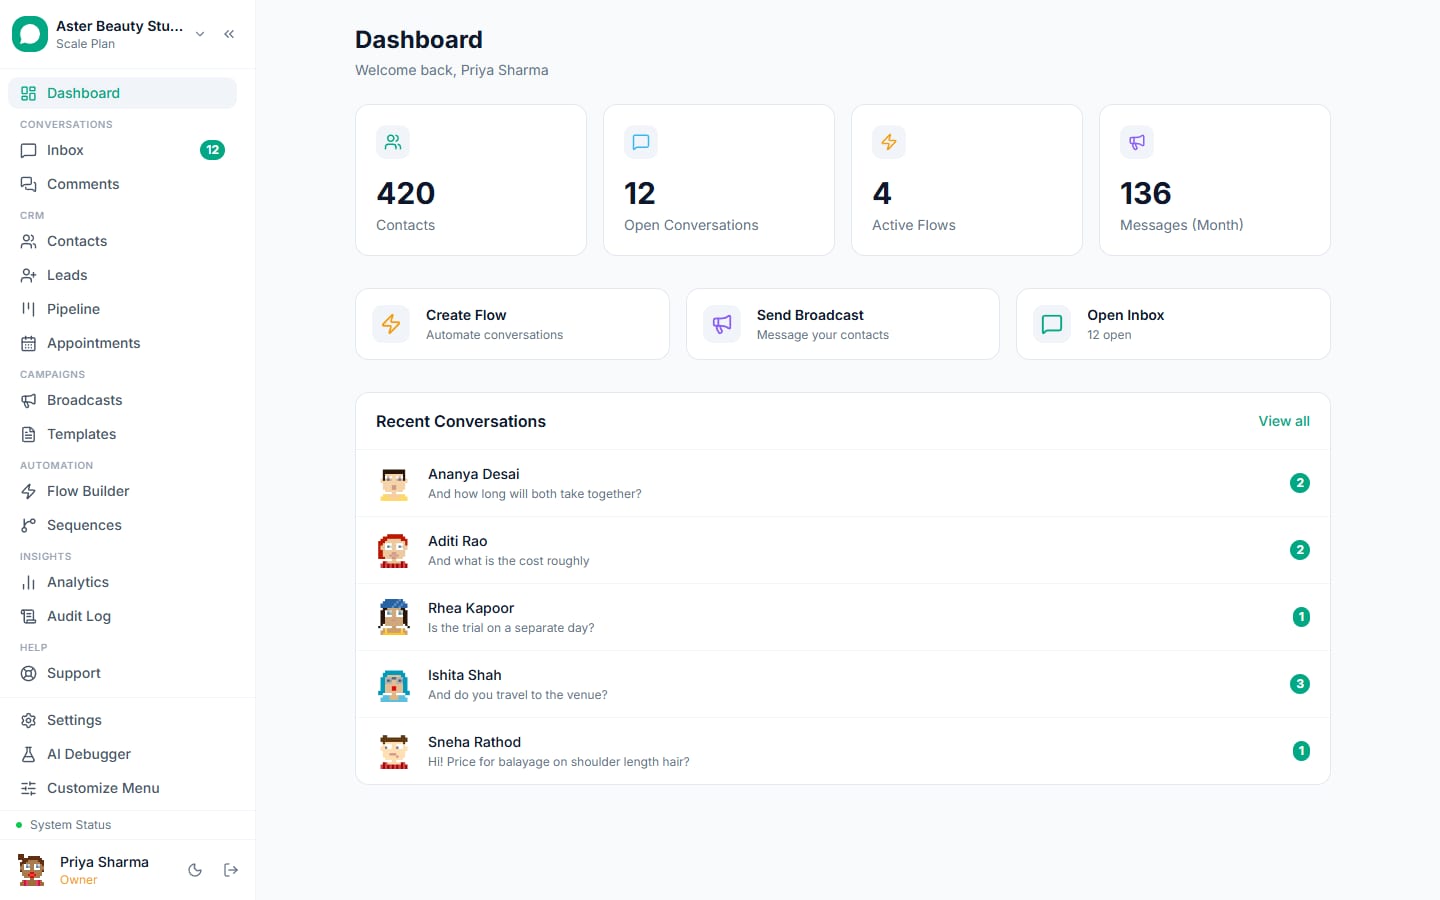
- One dashboard for message volume, delivery and read rates, sender quality, agent response times, revenue and campaign performance
- The Sender Quality card shows your number's live GREEN, YELLOW or RED rating and daily messaging tier, the same numbers Meta uses to decide how many people you can message
- Agent Performance reports conversations handled, first-response time and resolution time per team member, with Today, Last 7 days, This month and Last 90 days presets
- CSAT ratings collected through a 3-button WhatsApp message after a conversation resolves feed straight into the same dashboard
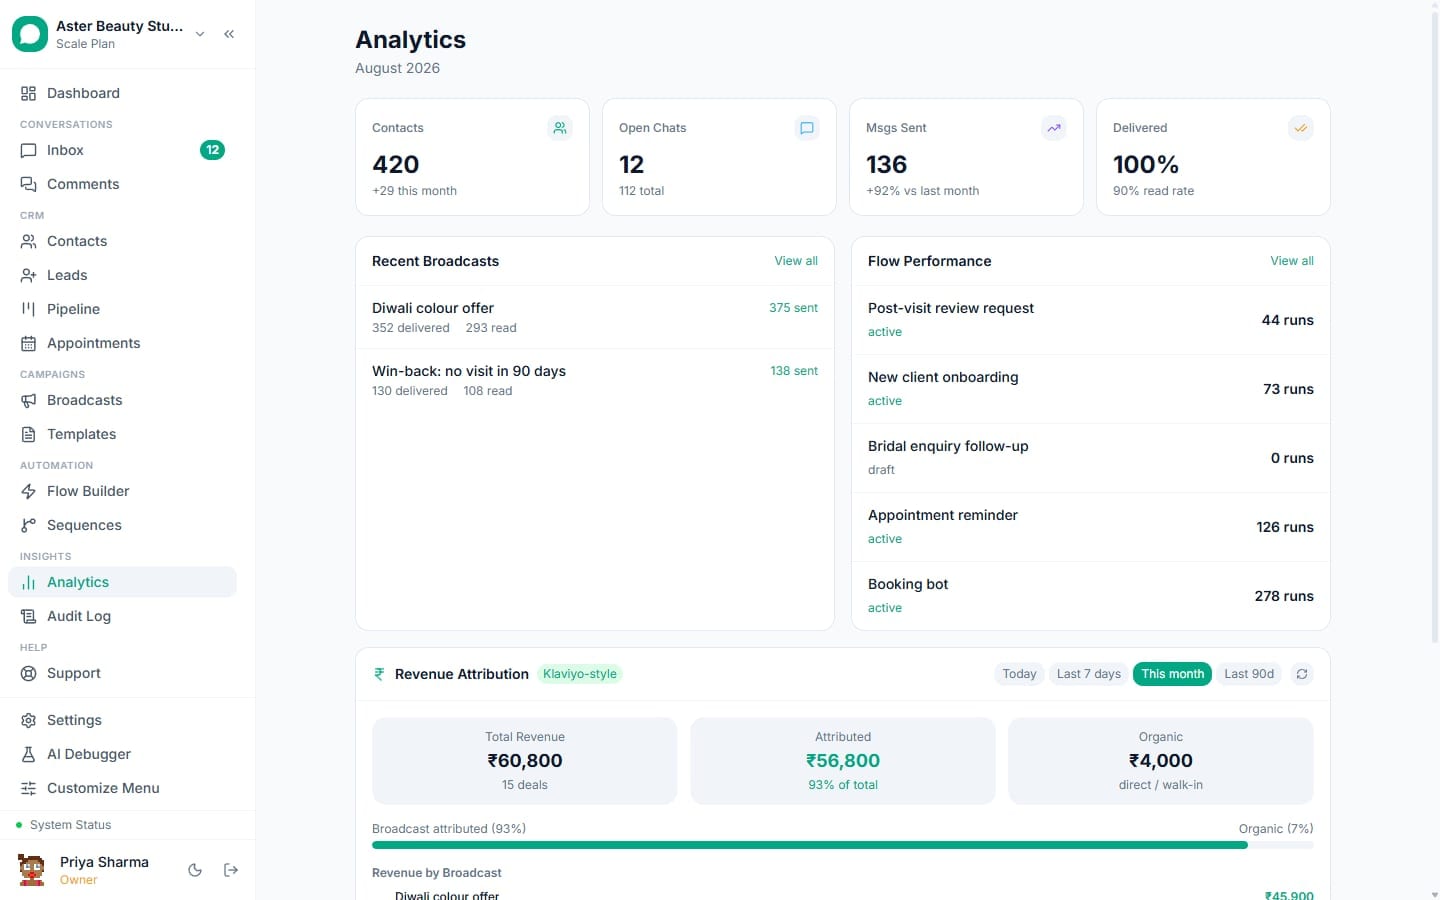
The WhatsApp Analytics Dashboard in VGraple CRM puts message volume, delivery and read rates, sender quality, agent performance, revenue and campaign results on one page, built from the same delivery statuses and quality signals Meta reports on your number. What changes for a business is not having to open five different screens, the broadcast list for delivery, the inbox for response times, Meta Business Manager for quality rating, to answer one question: is WhatsApp actually working for us this month, and where specifically.
What you get
- A KPI row: total contacts and this month's growth, open chats, messages sent this month with month-over-month change, and delivery and read rate
- A live Sender Quality card showing your number's GREEN, YELLOW or RED rating and daily messaging tier, with plain-language warnings when quality is degrading
- Recent Broadcasts and Flow Performance cards summarising your five most recent campaigns and flows without leaving the dashboard
- A Revenue Attribution widget with date-range presets, splitting attributed versus organic revenue and ranking campaigns by revenue
- Agent Performance reports: conversations handled, messages sent, average first-response time, resolved count and average resolution time, per team member
- CSAT collection through a 3-button WhatsApp message after resolution, feeding a satisfaction score into reporting
- Role-based visibility: broadcast and flow cards only render for roles with permission to view broadcasts or flows
How it works
- Open Analytics. The dashboard loads current-month totals by default: contacts, open conversations, messages sent, and your delivery and read rate, each with a comparison to the prior period where relevant.
Check Sender Quality. The quality card shows your number's live rating, pulled from Meta, and its daily messaging tier (for example 10,000 conversations a day). A YELLOW or RED rating shows an inline warning telling you specifically what to do, pause promotional broadcasts, send only to engaged contacts, before the number degrades further.
Review recent campaigns and flows. Recent Broadcasts lists your five most recently completed campaigns with sent, delivered and read counts; Flow Performance lists your five most recently updated flows with execution counts and status. Both link through to their full list for deeper detail.
Check revenue. The Revenue Attribution widget defaults to this month and lets you switch to Today, Last 7 days or Last 90 days. It shows total revenue, how much is attributed to a broadcast versus organic, and your top campaigns ranked by revenue.
Check your team's response times. Agent Performance shows, per agent, how many conversations they handled, how fast they replied to the first message on average, and how many they resolved, with the same date-range presets as revenue.
Drill into a specific campaign. Any broadcast on the Recent Broadcasts card links to its own detail page, which breaks the delivery funnel down by suppression reason, failure reason and delivery rate per recipient country, well beyond what the summary dashboard shows.
Why does delivery rate use "delivered or read," not just "delivered"?
WhatsApp's message statuses overwrite each other as a message moves through its lifecycle: sent, then delivered, then read. A message currently sitting at "read" no longer carries the status "delivered" in WhatsApp's own model, it has moved past it. Counting delivery rate as status = "delivered" alone would silently exclude every message a recipient has already opened, understating delivery rate and making it mathematically possible for read rate to exceed delivery rate, an obviously wrong result nobody would trust once they noticed it.
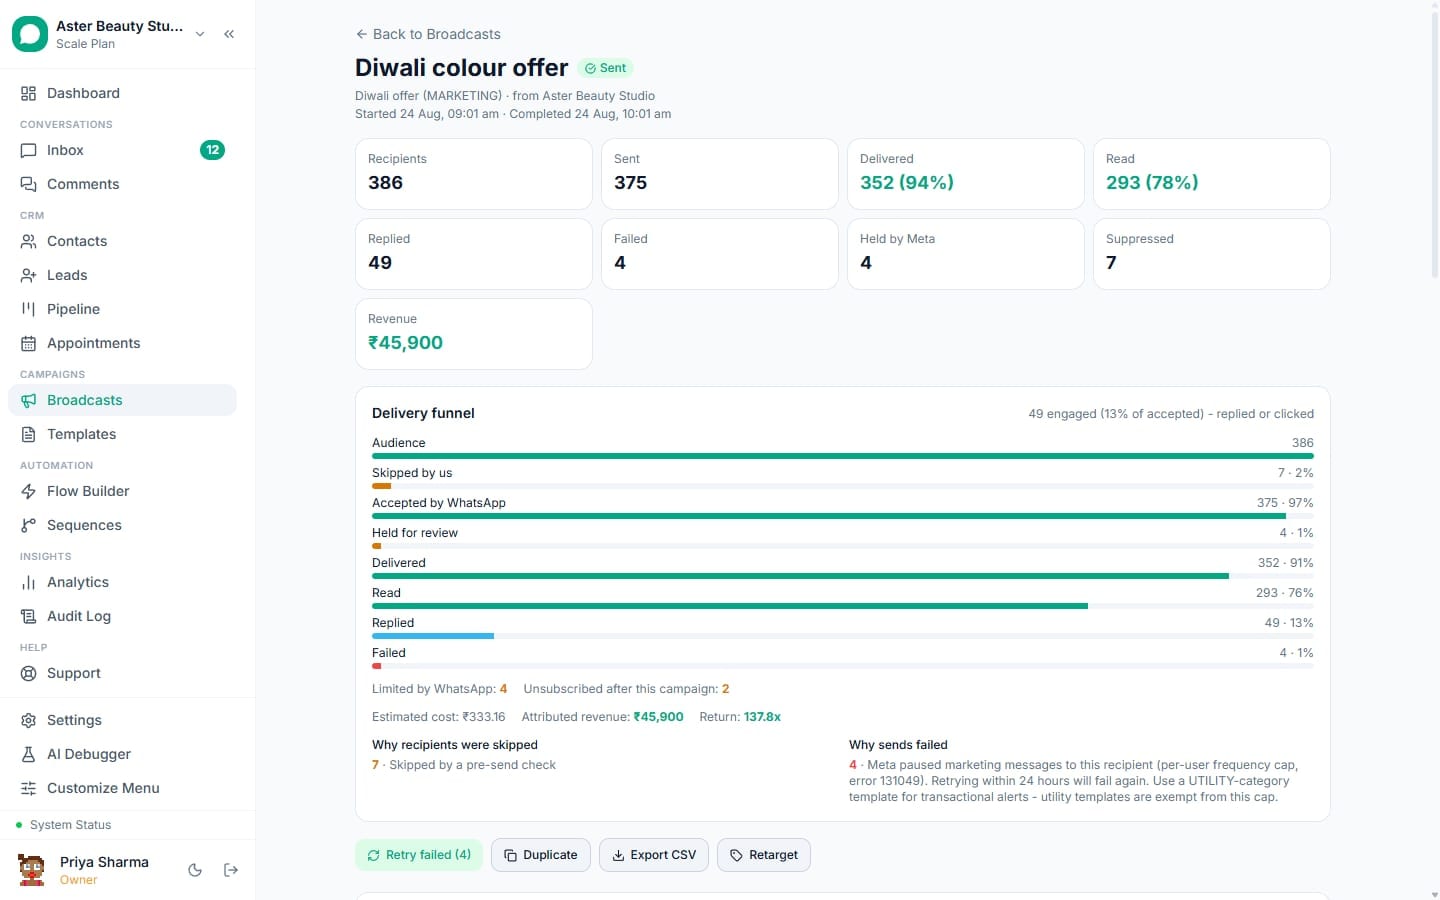
VGraple CRM's funnel math treats "delivered" as membership in a status group covering both delivered and read, so delivery rate is always greater than or equal to read rate, guaranteeing the numbers make sense at a glance rather than requiring an asterisk explaining why they do not.
What does the Sender Quality card actually protect you from?
A degraded quality rating caps how many people you can message in a day, and by the time a business notices messages failing, the rating has often already dropped. The card shows your WhatsApp number's live quality rating (GREEN, YELLOW, RED, or NA if not yet available), your daily messaging tier translated into a plain number of conversations per day rather than Meta's internal TIER_10K label, and the phone number or verified business name it applies to.
When the rating slips to YELLOW, the card shows a warning to pause promotional broadcasts, increase personalisation, and send only to highly engaged contacts until it recovers. At RED, the warning escalates: stop all broadcast campaigns immediately and send only to contacts who actively engage. This mirrors the sender-reputation pattern used by Twilio for SMS, applied to WhatsApp's own quality signal, so a business sees the warning on the same dashboard where it checks everything else, instead of having to separately monitor Meta Business Manager.
Example
A D2C store's number drops to YELLOW after an aggressive festive-sale broadcast produces a wave of blocks. The quality card's warning is the first place the owner learns about it, days before Meta would otherwise have visibly throttled sending, giving them time to slow down voluntarily instead of being forced to.
How does Agent Performance measure response and resolution time?
Response time is the metric every WhatsApp business claims to care about and few actually measure, because doing it by hand means someone reading timestamps in the inbox. Agent Performance reports, per team member, the number of conversations they handled and messages they sent, their average time to first response measured from when the conversation opened to when they first replied, the number of conversations they resolved, and their average resolution time from open to resolved. A first-response average of 10 minutes or under is highlighted, a threshold borrowed from the Zendesk-style SLA pattern where under 10 minutes materially changes whether a customer stays engaged.
The same date-range presets used for revenue, Today, Last 7 days, This month, Last 90 days, apply here, so a manager can check today's live workload or a quarter's trend with the same control.
What does CSAT collection look like, and when does it fire?
Asking for feedback through a separate survey link gets ignored inside WhatsApp; asking inside the same thread, right after the conversation resolves, gets answered. When a conversation moves to resolved and CSAT is enabled in settings, VGraple CRM sends a WhatsApp interactive button message, "How was your experience with us today?" with three reply buttons: Great, Okay, Poor, the maximum WhatsApp allows on a single button message. The request only sends if the 24-hour service window is still open and only once per resolution cycle, so a customer is never asked twice for the same interaction.
A tap on any of the three buttons records the score on the conversation, sends a one-line thank-you, and does not reopen the conversation, since a rating reply should never be mistaken for the customer wanting to continue the conversation or trigger a bot response.
Who uses it
Clinics watch their sender quality rating closely around appointment-reminder season, since a spike in utility-category sends that gets mishandled as marketing can drag quality down fast. See WhatsApp CRM for clinics.
Salons and spas use Agent Performance to see which staff member is actually converting WhatsApp enquiries into bookings, not just replying fastest. See WhatsApp CRM for salons.
Real-estate agencies track revenue attribution by broadcast to know which listing campaigns are worth repeating, since a campaign with a high read rate but zero attributed revenue is not actually working. See WhatsApp CRM for real estate.
Coaching institutes use CSAT after every counselling conversation to catch a poor experience before it turns into a lost enrolment, rather than finding out from a cancelled admission weeks later.
Travel agents watch message volume trends month over month during peak booking seasons, using the KPI row's growth comparison to plan staffing before a seasonal spike arrives rather than reacting to it after the inbox is already overloaded. See WhatsApp CRM for travel agencies.
How does the dashboard respect who is allowed to see what?
A shared dashboard that shows every agent's individual performance to every other agent, or shows broadcast results to a role that cannot send broadcasts, creates friction that has nothing to do with analytics. The Recent Broadcasts and Flow Performance cards only render for a session that holds broadcasts:view or flows:view permission respectively, so a support agent with inbox-only access sees a dashboard scoped to what they can actually act on, not a wall of numbers for features they cannot touch. Agent Performance itself is visible to roles with reporting access rather than every agent seeing every colleague's response-time ranking by default, keeping the dashboard useful for a manager without turning it into a leaderboard nobody asked for.
What Meta allows
VGraple CRM polls and caches your quality rating and messaging tier from Meta's Graph API rather than estimating it, so the number on the dashboard is Meta's own figure, not a derived approximation.
Plans and limits
The Analytics dashboard, including Sender Quality, Revenue Attribution and Agent Performance, requires Starter or above. On Free, the underlying data these views summarise, individual broadcast delivery funnels, revenue events on conversations, and conversation history, is still fully recorded and visible on each conversation or broadcast; what Starter adds is the aggregated dashboard across your whole account.
Recent improvements
- 2026-08-24: The system console redesign established that any new operational signal earns space on the analytics or system dashboard, not a new standalone card elsewhere, keeping reporting consolidated in one place as new capability ships.
- 2026-08-19: Broadcast v3 added revenue and cost to the campaign comparison view (
/broadcasts/compare), letting up to five campaigns be ranked side by side by delivery, revenue and estimated send cost. - 2026-08-18: Sender-side delivery integrity work in Broadcast v3 added the webhook indexes and send-time safety checks the Sender Quality card and delivery funnel depend on for an accurate, current reading.
- 2026-07-14: Delivery error handling was rebuilt so every Meta error code shown in the failure-reason breakdown maps to a plain-language explanation instead of Meta's raw one-line description.